
On this page
- Is AI actually causing the job cuts?
- If AI spending is at record levels, why is measurable ROI flat?
- Why is cutting a role the worst way to prove ROI?
- What does a task-level ROI model look like for an Australian SME?
- What does local AI change about the maths?
- When should you cut a role instead of redeploying the hours?
- What should you measure before you automate anything?
- Frequently asked questions
- Is AI really causing job cuts?
- Why is AI ROI so hard to measure?
- How do I calculate ROI for an AI automation?
- Is it cheaper to cut staff or automate tasks?
- What does local AI cost per million tokens?
- What payback period should I expect from an AI automation?
Last Updated: 2026-11-21
Key takeaways
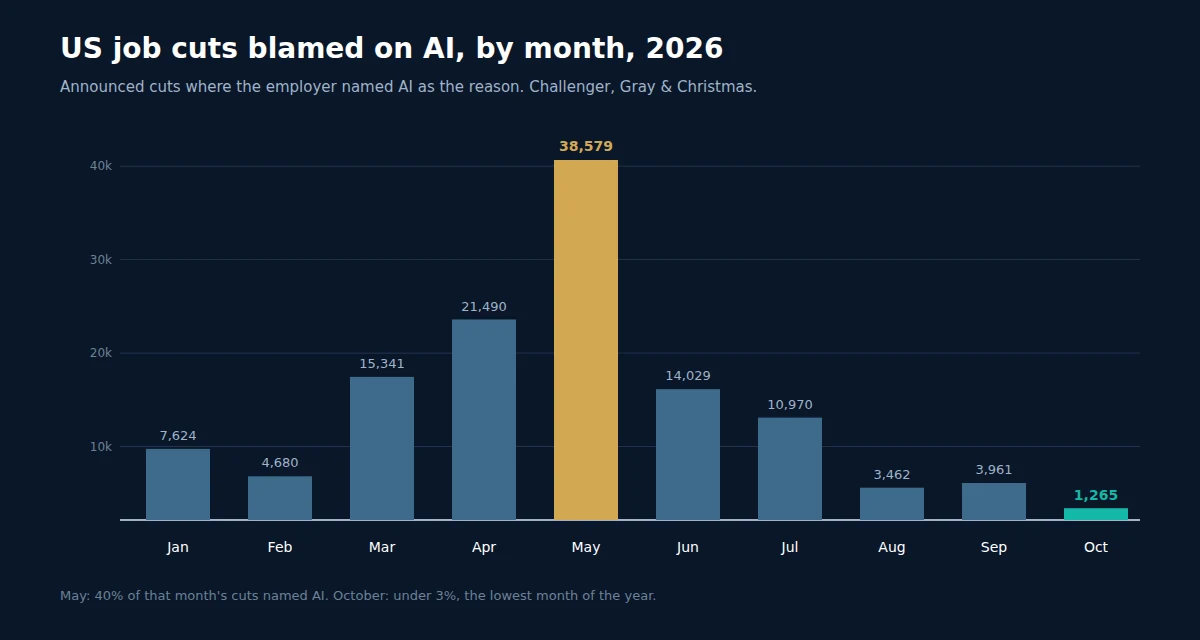
- ▪ US employers announced 121,401 job cuts citing AI in the first ten months of 2026, more than double the 54,836 they attributed to AI in all of 2025, according to Challenger, Gray & Christmas.
- ▪ Those AI-cited cuts are about 20% of the 617,189 total announced cuts, and total announced cuts are down 44% on the same period last year. The labour data does not show mass displacement.
- ▪ AI attribution peaked at 38,579 cuts in May 2026, about 40% of that month, then fell to 1,265 in October, under 3%. A reason that collapses that fast looks more like an excuse than a cause.
- ▪ The four largest hyperscalers guided to roughly US$690 billion of capital expenditure for 2026, while McKinsey's State of AI survey puts the share of firms attributing any EBIT impact to AI at 37%, flat on last year.
- ▪ Headcount cuts are the crudest ROI lever. A task-level model on 15 admin hours a week, 60% automated, nets about A$18,280 a year after supervision and build cost, with a payback of nine months.
- ▪ Local models change the run-cost line, not the supervision line. Our dual DGX Spark setup serves DeepSeek V4.1 Flash at under A$1.20 per million generated tokens at the wall, but a person still has to own the output.
The ROI is not in the layoffs. It is in the hours a specific task stops consuming. That distinction matters because the story most businesses are being sold in November 2026 runs the other way: AI spending is at record levels, job cuts are being blamed on AI, and the implied conclusion is that automation must be printing money. The numbers do not support that conclusion. AI-attributed layoffs are self-reported, they peaked in May and collapsed by October, total announced cuts are actually down 44% year on year, and only 37% of firms told McKinsey they see any EBIT impact from AI at all. Meanwhile the hyperscalers are on track to spend roughly US$690 billion on infrastructure in 2026. Spending more and proving less is not a paradox. It is what happens when you buy tools before you define the work. Here is what the layoff data really says, why headcount cuts are the worst way to demonstrate ROI, and the task-level model we use with Australian clients.
Is AI actually causing the job cuts?
Partly, and far less than the headlines imply. According to Challenger, Gray & Christmas, US employers announced 617,189 job cuts in the first ten months of 2026, of which 121,401 explicitly named AI as the reason. That is about 20% of the total and more than double the 54,836 AI-attributed cuts recorded in all of 2025. The important context sits one line further down the same report: total announced cuts are down 44% compared with the same period last year. Fewer jobs are being cut overall, not more. And Challenger's count records the reason an employer gives in its announcement, not an independent finding about what caused the cut.
If AI spending is at record levels, why is measurable ROI flat?
Because most of the money is going into capability, not into redesigned work. Alphabet guided 2026 capital expenditure to US$175 billion to US$185 billion, Amazon flagged about US$200 billion, Microsoft went to US$190 billion and Meta raised its range to US$125 billion to US$145 billion, which puts the four together near US$690 billion for the year. Against that, McKinsey's State of AI survey for 2026 finds 37% of respondents attributing at least some EBIT impact to AI, about the same share as a year earlier. Elena Magrini, an economist at Lightcast, put the gap plainly to Human Resources Director America: "There are narratives currently that note AI is 'replacing' workers en masse. Simply put, we are not seeing that in the labor data." Magrini's diagnosis is that rollouts start from the wrong question, asking what can be automated instead of which business problem needs solving. A plan that cannot name the work it changes, or the number it moves, is just cost cutting with a model attached.
Why is cutting a role the worst way to prove ROI?
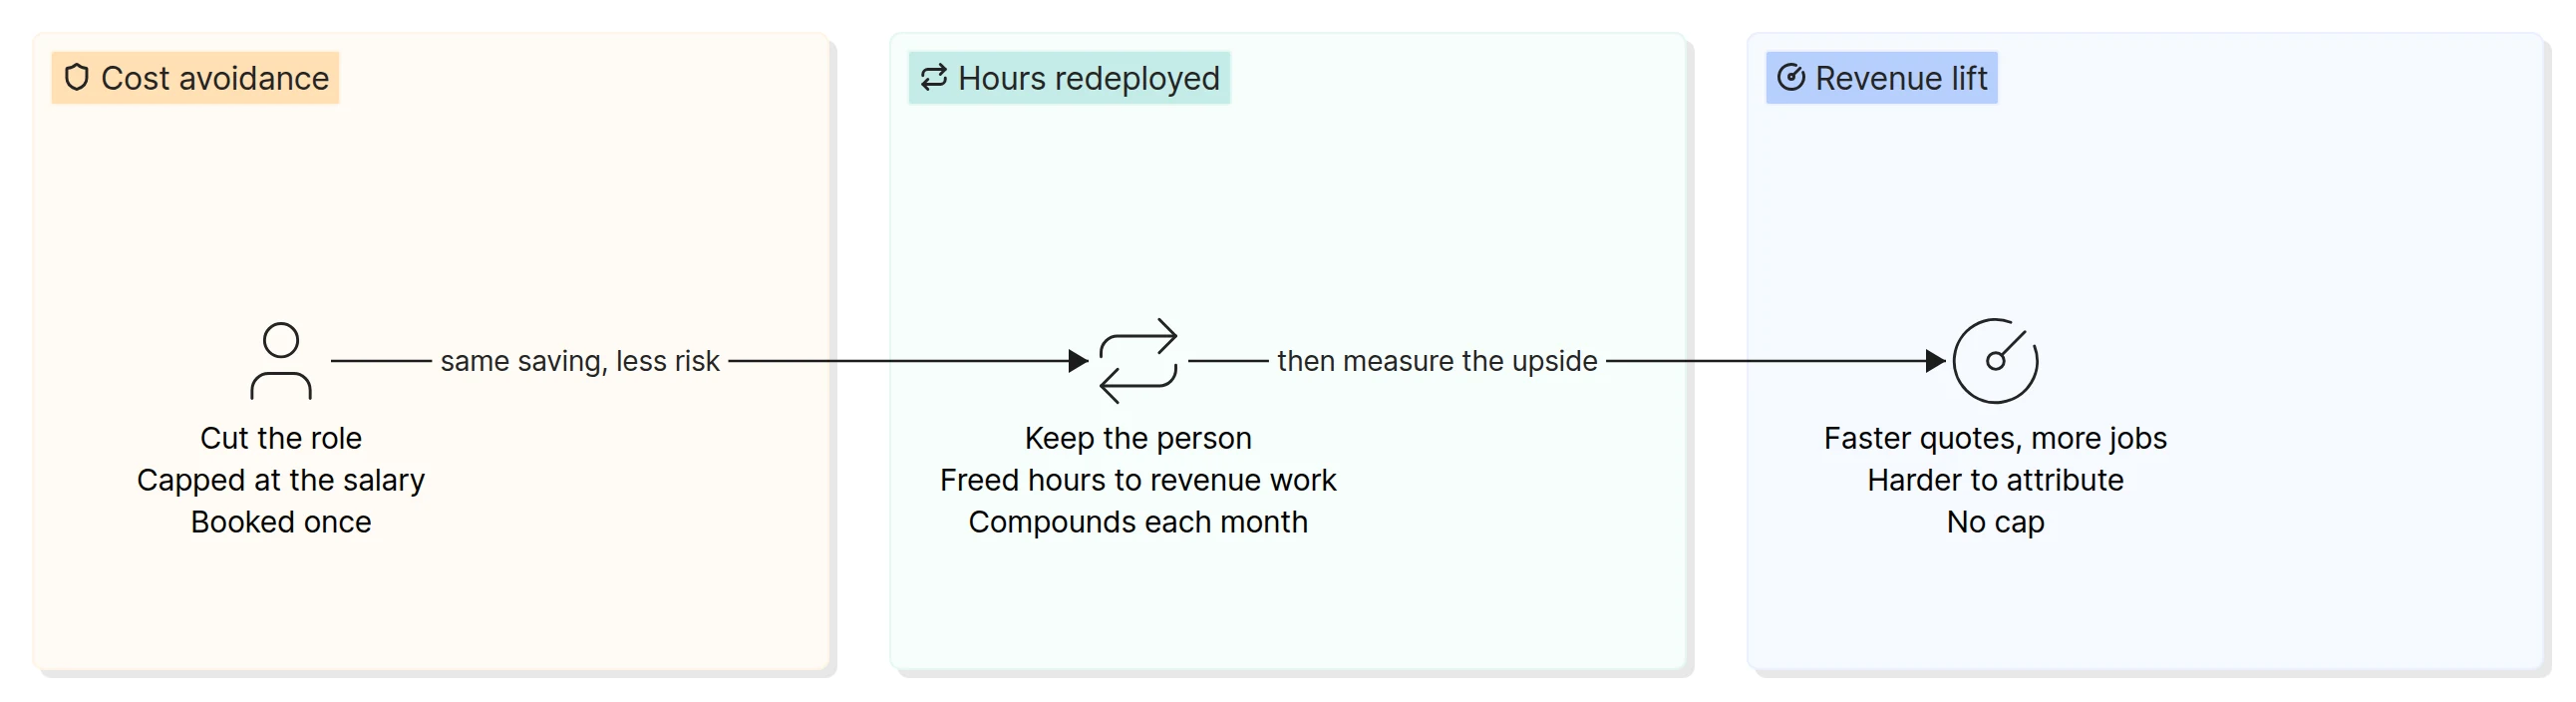
Because it produces one number, once, and it removes the person who understands the exceptions. A headcount cut is capped at the salary you stop paying. Australian average weekly ordinary time earnings were $2,083.70 in May 2026, according to the Australian Bureau of Statistics, which annualises to about $108,352. Add 12% superannuation and roughly 20% for leave and overhead and the loaded cost of that role is about $145,600, or $70 an hour across 2,080 paid hours. Cut the role and you book that saving in one line. But the agent you deployed still needs an owner, the exception queue still needs judgement, and the institutional knowledge that made the process work walks out with the person. What you have booked is cost avoidance, not return, and it does not compound.
Task-level automation does compound, because the same person produces more, or the freed hours move to work that earns revenue. Andy Challenger, chief revenue officer at Challenger, Gray & Christmas, told HRD America that the narrowest use cases pay off first, citing a large employer that pointed AI at its employee handbook and the benefits data in its HR system so staff could ask questions directly. The result was not a layoff. It was HR business partners freed from repetitive queries. That is the pattern worth copying, and it is the opposite of the announcement-driven cut.
What does a task-level ROI model look like for an Australian SME?
It fits on one page and uses five numbers: baseline hours, loaded hourly rate, gross annual value, the drags, and net value against payback. Start with the hours the task actually consumes today, measured rather than guessed. Price the hour honestly, including superannuation, leave and overhead. Multiply by the weeks the work runs, subtract supervision and run cost, then amortise the build over three years. If the payback is longer than the life of the process, the automation is a hobby, not an investment. The model is deliberately boring. It is also the only version that survives a conversation with an accountant.
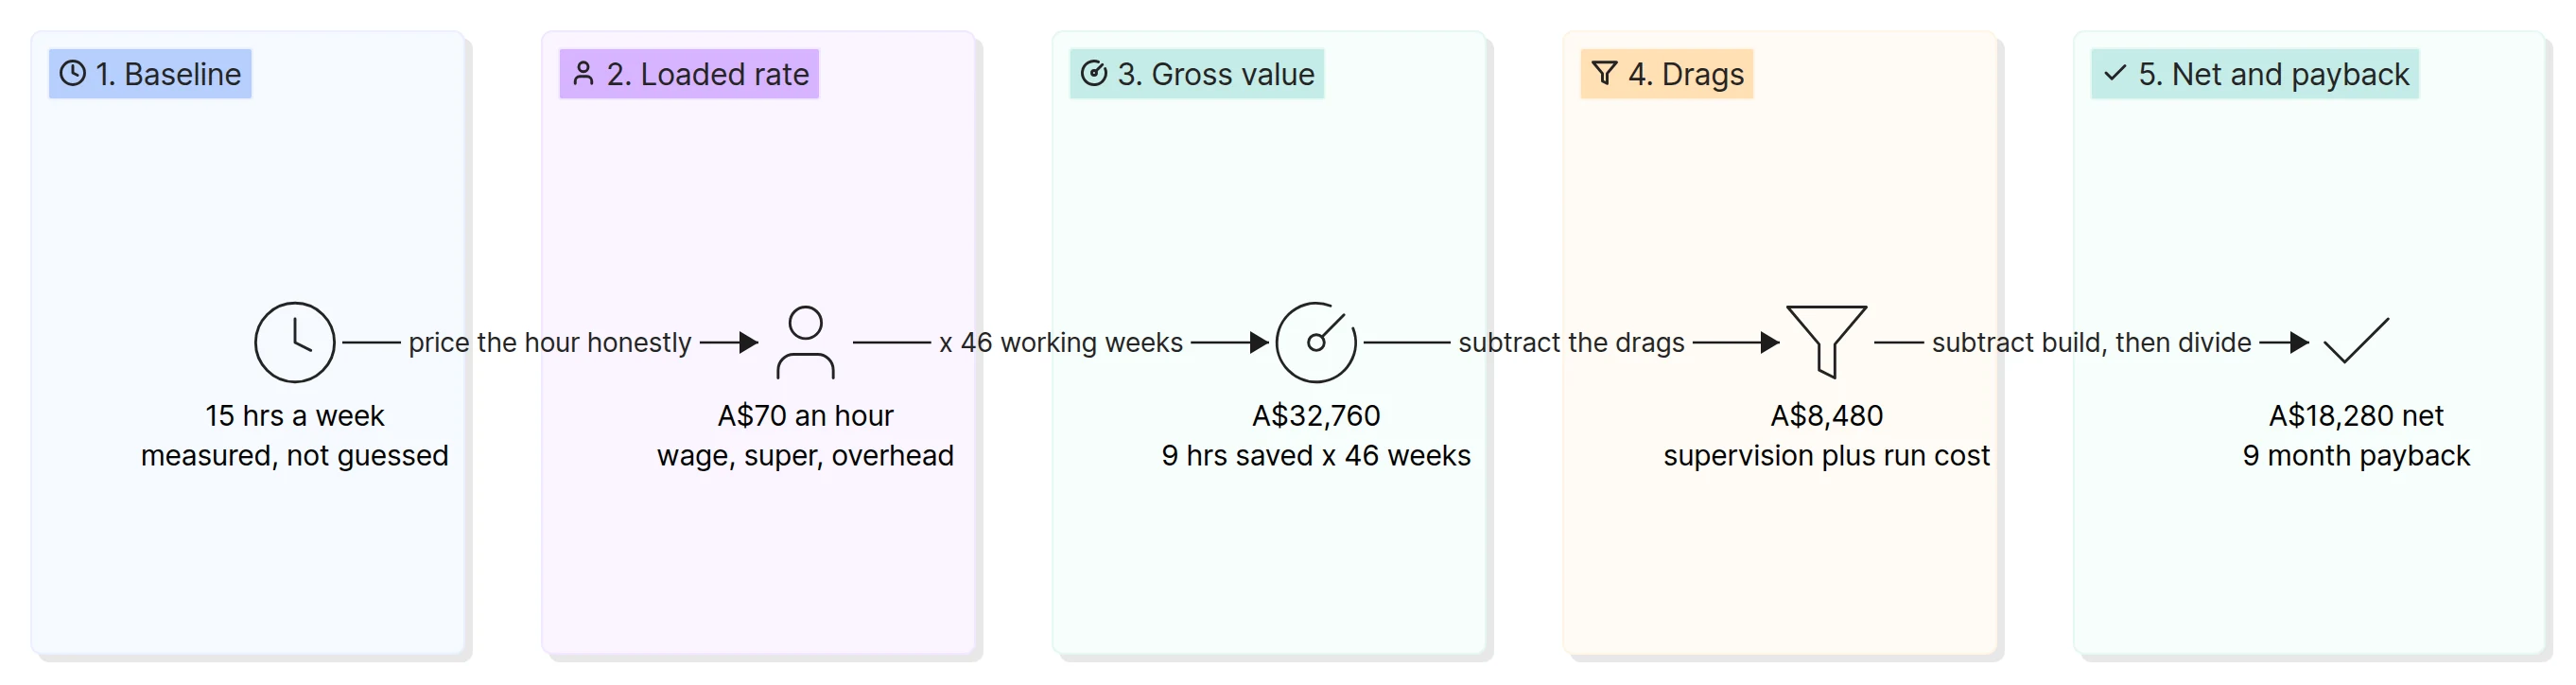
Here is the worked example we use. A business spends 15 hours a week on a rule-bound admin task, invoicing, quote follow-ups or inbound triage. Automation removes 60% of it, so 9 hours a week come back. At the $70 loaded rate above, that is A$32,760 a year across 52 weeks, because the work does not pause for anyone's leave. Supervision costs 2 hours a week, A$7,280, since someone has to review the output. Run cost is A$100 a month on local hardware, A$1,200 a year. The build is A$18,000, amortised at A$6,000 a year. Net value lands at A$18,280 a year, and payback on the build is about nine months once you use operating cash flow rather than the amortised figure.
| Line | Basis | Annual value |
|---|---|---|
| Hours saved | 9 hrs a week x 52 weeks x A$70 | A$32,760 |
| Supervision | 2 hrs a week x 52 weeks x A$70 | -A$7,280 |
| Run cost | Local hardware at A$100 a month | -A$1,200 |
| Build, amortised | A$18,000 over three years | -A$6,000 |
| Net annual value | Operating cash flow A$24,280, payback 9 months | A$18,280 |
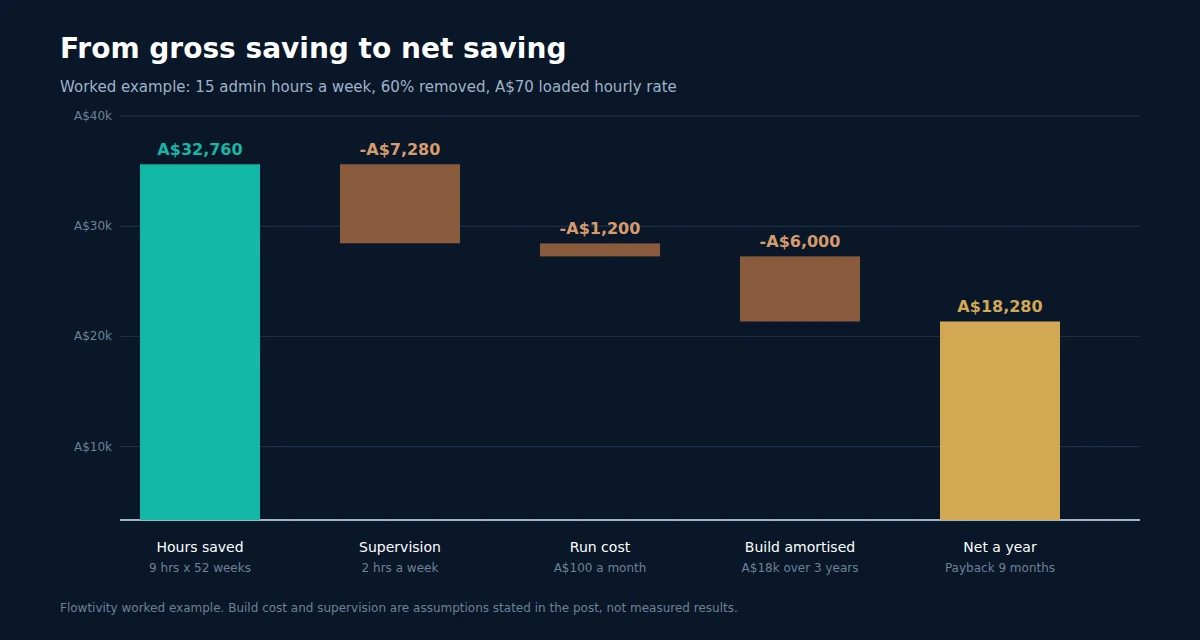
Two things are worth noting about that table. First, supervision is the largest drag, and it is the line vendors omit. A workflow that saves 9 hours but needs 4 hours of checking saves 5. Second, the build amortisation is a real cost, but payback should be measured against operating cash flow, which is why nine months is the right figure to quote and 15 months is the right figure for an accountant's depreciation schedule. The same model, applied to a low-volume judgement task, usually fails. If more than about a fifth of cases are exceptions, the supervision line eats the saving. Our earlier breakdown of where automation actually pays off covers which tasks pass that test.
What does local AI change about the maths?
It changes the run-cost line and the data-residency story, not the supervision line. In our dual DGX Spark setup, 128GB of unified memory across two GB10 machines drawing about 0.48 kW combined, the marginal cost of generation is the electricity bill. At a Queensland tariff of about A$0.30 per kilowatt hour, that is roughly A$0.14 an hour, or A$105 a month if the machines run around the clock. Our measured throughput on DeepSeek V4.1 Flash is about 35 tokens per second on a single stream and 62 at four concurrent streams, which works out to under A$1.20 per million generated tokens on one stream and about A$0.65 per million at four. That is the wall cost for decode, before prefill, so treat it as a floor rather than a full bill. For an Australian business, the other half of the value is control: the Privacy Act 1988 APP 8 requires reasonable steps before disclosing personal information to an overseas recipient, and a model running on your own hardware removes that question entirely. If you are weighing hardware against subscriptions, the 2026 cost guide has the pricing ranges.
When should you cut a role instead of redeploying the hours?
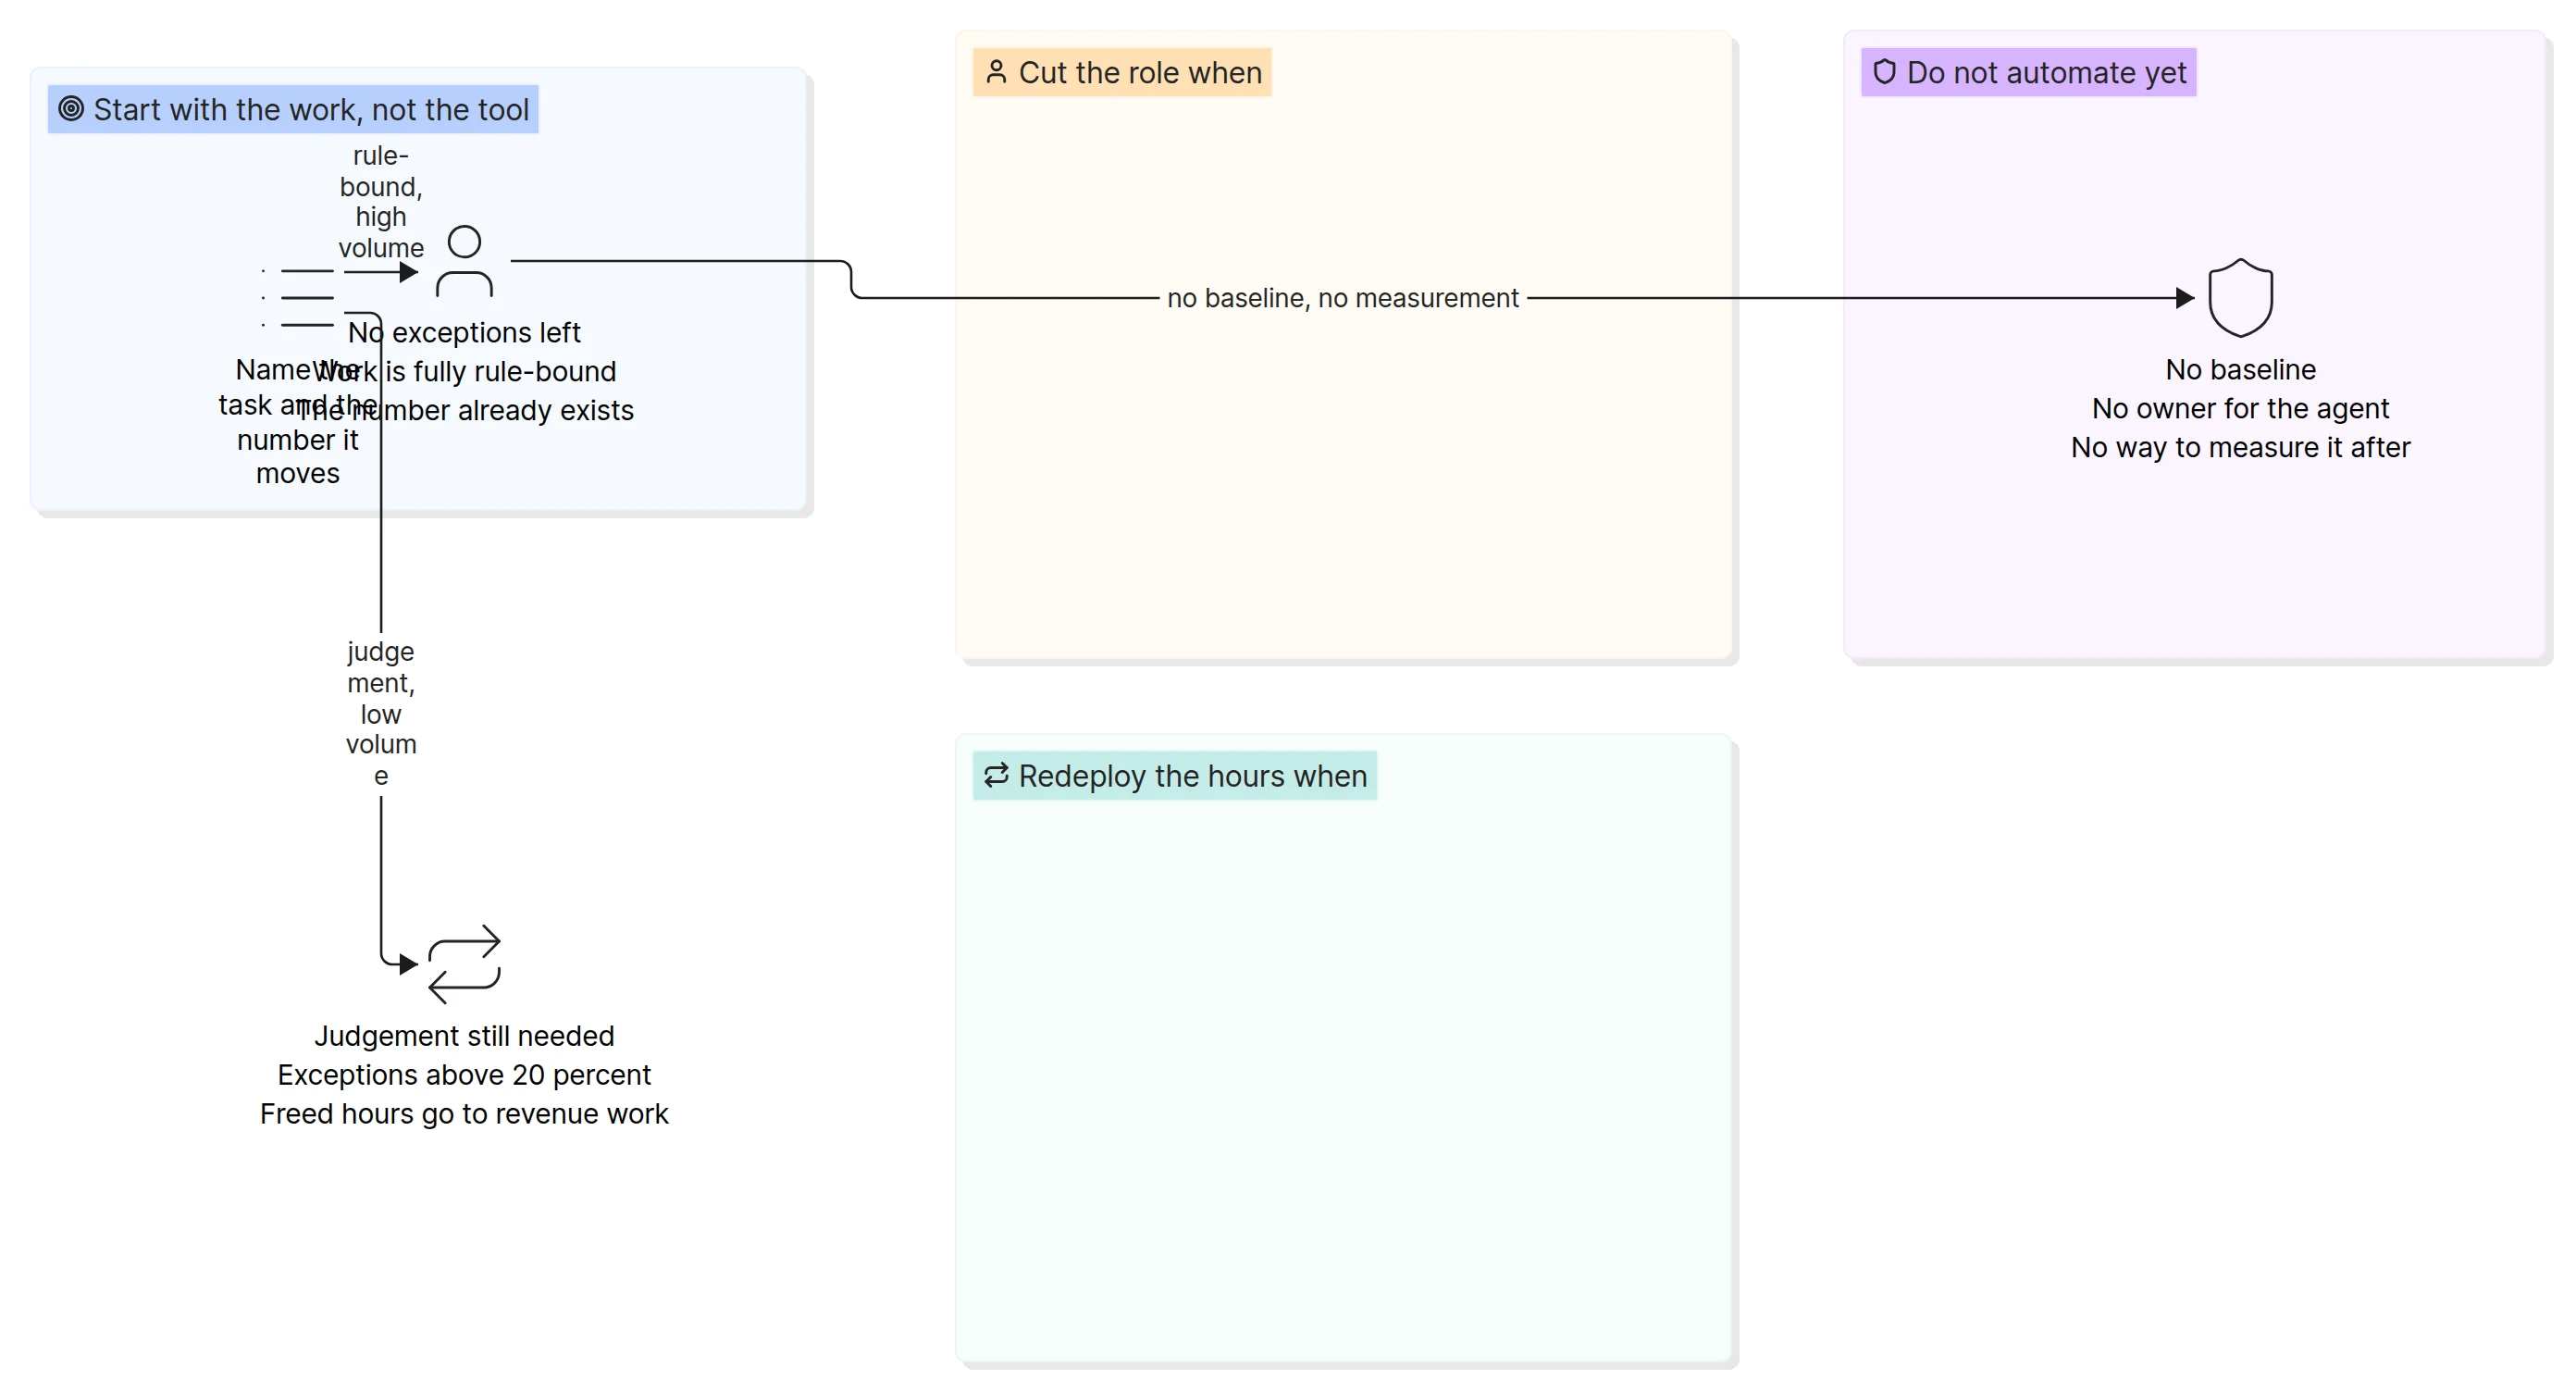
Rarely, and only under three conditions. The work has to be fully rule-bound with no judgement left in it, the exception rate has to be low enough that supervision is a fraction of the saved time, and the number you are moving has to exist already so you can prove the change afterwards. If any of those three is missing, redeploy the hours instead. Cutting a role to prove an AI project worked is a decision made for the board deck, not for the business. The person who knows why the exceptions happen is the same person who keeps the automation honest.
What should you measure before you automate anything?
Five things, and none of them are model benchmarks. Measure the baseline first: how long the task takes now, how often it goes wrong, and what it costs when it does. Record the exception rate, because it sets your supervision budget. Name the owner of the agent, a person rather than a team, who signs off on output quality each week. Pick the metric you will compare against in 90 days, and make sure it existed before the project started. Finally, write down the payback threshold you will accept, in months, before anyone builds anything. If a proposal cannot answer those five questions, it is a pilot, not a business case, and the pilot graveyard is already full: the MIT NANDA study found 95% of organisations reporting zero return from GenAI pilots, and Gartner expects more than 40% of agentic projects to be cancelled by the end of 2027. The difference between the 37% that see EBIT impact and the rest is almost never the model. It is whether the work was defined before the tool was bought.
Frequently asked questions
Is AI really causing job cuts?
Only partly. According to Challenger, Gray & Christmas, 121,401 US job cuts in the first ten months of 2026 named AI as the reason, about 20% of all announced cuts. Total announced cuts fell 44% year on year, and the AI attribution dropped from 40% of May's cuts to under 3% in October, so the labour data does not support mass displacement.
Why is AI ROI so hard to measure?
Because most projects never define the work they are meant to change or the number they are meant to move. McKinsey's 2026 State of AI survey found 37% of firms attributing any EBIT impact to AI, flat on last year, while capital spending kept rising. Without a baseline and a metric that existed before the project, there is nothing to compare against.
How do I calculate ROI for an AI automation?
Multiply the hours saved each week by the loaded hourly rate and the number of weeks the work runs, then subtract supervision time and run cost. Amortise the build over three years for the annual figure, but measure payback against operating cash flow before amortisation. In our worked example that produces A$18,280 net a year and a nine-month payback.
Is it cheaper to cut staff or automate tasks?
Cutting a role produces a bigger single-year number, capped at the loaded salary of about A$145,600 for an average Australian full-time role. It also removes the person who understands the exceptions and does not compound. Task-level automation keeps the person and compounds the gain, which is why it usually wins over three years.
What does local AI cost per million tokens?
In our dual DGX Spark setup, about A$1.14 per million generated tokens on a single stream and A$0.65 per million at four concurrent streams, based on 0.48 kW of draw at a Queensland electricity tariff. That is a decode-only floor, before prefill, and it excludes hardware purchase.
What payback period should I expect from an AI automation?
Six to twelve months for a rule-bound, high-volume task with a low exception rate, and longer for anything involving judgement or messy data. If the modelled payback is beyond the life of the process, do not build it. Pilot first, measure for 90 days, then decide.
About the author. AJ Awan is the founder of Flowtivity, an AI consultancy on the Gold Coast. He is a former EY management consultant and a TOGAF certified enterprise architect, and he builds local and private AI systems for Australian mid-market firms.
What's actually useful in AI, every Friday
We follow everything happening in AI and send what's worth your time: new models, AI agents, and how to put them to work. One email a week, unsubscribe anytime.